Monitoring CPU & Memory Usage
1-1: Identify your agent on the dashboard
In this portion of the lab, you will be monitoring your system's CPU, memory and other performance related metrics.
After your agent started, navigate to More -> Agents -> Agent Details. Sometimes, it takes a few minute for the agent to list here, so wait for a few minutes. You can search with the system hostname as well. Click on the FQDN name of your agent to see the details.
It opens Agent dashboard which displays various information like CPU Load, JVM Memory, System Memory, Garbage Collection, Open Files, Network, Logs, etc.
For more details please refer the documentation.
Also, an example can be found here.
1-2: Navigate your server through Infrastructure menu
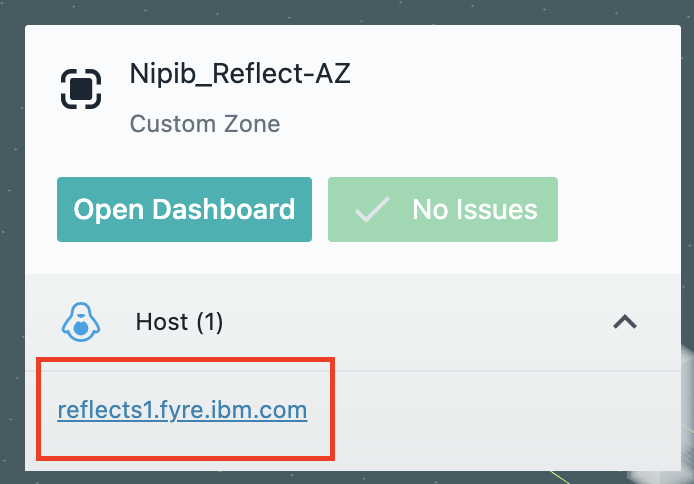
Navigate to Infrastrurce and look for your name under AZ.

Click on the AZ name (eg. BipinChandraAZ) and then select the host.

Then click on 'Open Dashboard'. It opens a host view, which displays several host related metrics like CPU, memory and other performance related metrics.
See here for example of host related metrics.
This is where you can execute CPU & Memory Freak Java application and monitor the real time CPU and memory usage.
*/